
Logging is followed in almost every project. However, most of the time we end up using logs only for debugging and auditing purpose. Since past few projects we have been exploring more opportunities for leveraging logs for purposes like application metrics collection, reporting, monitoring and alerting. And during this, I learnt about structured logging and how it enables us to achieve lot more using logs.
Lets first look at what we need to follow while logging to achieve structured logging.
What is structured logging?
Not only log level is important, but what we log & how we log also matters. Lets look at the default log message format,
127.0.0.1 [2014-07-22T18:12:27.200+0530] "GET /api/modules/doc_id/navigation HTTP/1.1" 200 476
Above message is interpreted well by humans since we know, 120.0.0.1 is IP, 2014-07-22T18:12:27.200+0530 is timestamp, GET is request methods, 200 is response status and 476 is server response time. And such interpretation is required for each message logging.
Let’s provide structure to the above log message,
ip="127.0.0.1" timestamp="2014-07-22T18:12:27.200+0530" method=GET
url="/api/modules/doc_id/navigation" protocol=HTTP/1.1 status=200 responseTime=476
Above structured message is self explanatory and easy to parse and index by system. This technique of key=value style logging is also known as logging with context. Using above log message keys we can find all slow pages, by querying logs with status = 200 and responseTime > 2000.
Now lets take some examples of structured logs to understand it usage better.
Examples
Background job logs
Most of the application now days have have background jobs running at regular interval. With following structured logging for each jobs,
timestamp="2014-07-22T18:12:27.200+0530" host=server20  tag=jobserver jobName=image_upload
jobStartTime="2014-07-22T18:10:00.100+0530" jobEndTime="2014-07-22T18:12:27.100+0530"
jobExecutionTime=9840 jobStatus=success noOfImageUploaded=125
following can be achieved,
- Get alert message when jobStatus is failure, we do
- Monitor average job execution time and we have setup for each job if it reaches more than average sends alert.
- Monitoring average response time also helps in tuning the frequency of the job runs.
- To analyze random failure or slowness in jobs, information in log is really useful to find if it is failing on specific hosts or at specific time or when run in parallel with any other jobs or no of items are too many to process etc.
- Using more meta info like noOfImageUpload and jobExecutionTime we can calculate average time for each image upload.
Distributed correlated logs
With distributed and microservice architecture, it is quite natural to have logs spread across systems. With structure logs and using common transaction id shared across systems, we can correlate logs and turn logs into information used for debugging, auditing, reporting and monitoring.
Lets take the example of order request after successful payment.
timestamp="2014-07-22T18:12:27.100+0530" host=server01 tag=webServer
transactionId=458748939 cientIP=83.84.85.86 sessionId=123456789
message="Order confirmation request received"

timestamp="2014-07-22T18:12:27.200+0530" host=server03 tag=orderService
transactionId=458748939 message="Order created"
orderAmount=550

timestamp="2014-07-22T18:12:27.250+0530" host=server03 tag=inventoryService
transactionId=458748939 message="Online inventory updated"

timestamp="2014-07-22T18:12:27.300+0530" host=server07 tag=paymentService
transactionId=458748939 message="Payment details stored against order."
paymentMode=CreditCard

timestamp="2014-07-22T18:12:27.350+0530" host=server05  tag=couponService
transactionId=458748939 message="Redeem coupon ABCDE marked for user."
couponType=REWARD couponCode=ABCDE

timestamp="2014-07-22T18:12:27.400+0530" host=server01 tag=webServer
transactionId=458748939 message="Request completed"

timestamp="2014-07-22T18:12:28.500+0530" host=server06  tag=emailService
transactionId=458748939 message="Order email sent"

timestamp="2014-07-22T18:12:27.450+0530" host=server05  tag=rewardService
transactionId=458748939 message="Reward points updated."

timestamp="2014-07-22T18:15:00.100+0530" host=server25  tag=shippingService
transactionId=458748939 message="Order received by shipment system."
with above messages we can,
- We are better equipped with debugging issues across systems including async steps of the transaction. Using transactionId we can connect logs and findout client/user specific details and track incident. e.g. track couponCode used by user with connecting logs from couponService to webServer
- Using paymentMode, we can learn more about what kind of payment modes are preferred by customers.
- Calculate average response time in processing order request.
Leverage apache mod_unique_id module to generate transaction id at web server and later share it with other services by passing it in request headers.
Tools
Splunk, is best in class, commercial product. We are using it in production for large system generating more than 100GB of logs per day. Splunk would be my personal recommendation as well. Lets take example and learn more about using Splunk.
Lets find 404s on website using Splunk
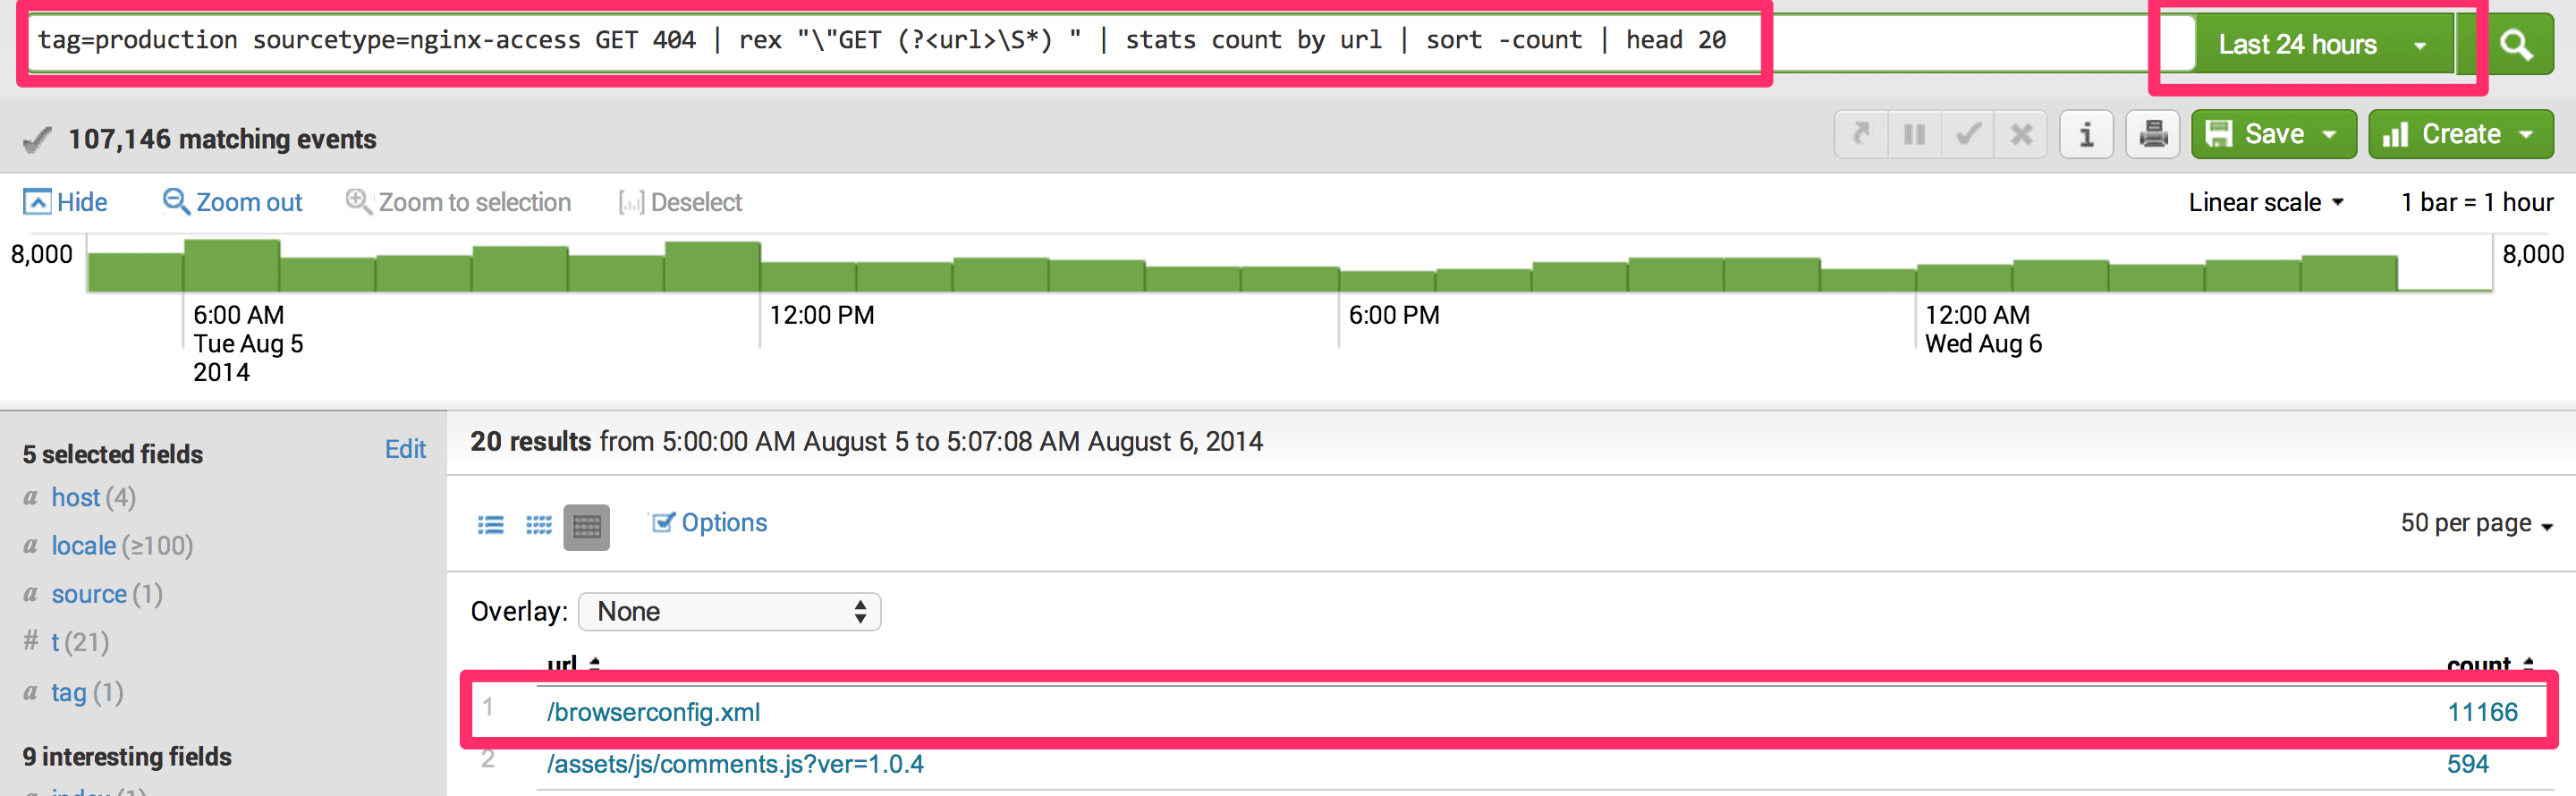
Query: tag=production sourcetype=nginx-access GET 404 | rex "\"GET (?<url>\S*) " | stats count by url | sort -count | head 20
Lets understand query in detail. Splunk support unix style pipes in query, so you could pass output of one command to another and build on. In above example we used 5 different commands,
tag=productionandsourcetype=nginx-accesswithGET 404returns all 404 log statements from all productions servers and source file name nginx-accessrex "\"GET (?<url>\S*) "extract URL from the log using reg-exstats countby url group and count by urlsort -countsort in descending order on counthead 20take first 20 from the result set
LogEntries is another feature rich SaaS solution on cloud. Other options are Loogly, PaperTrail.
LogStash + Elasticsearch + Kibana combination is best open-source one in this space.
GrayLog2, open-source log analytics solutions. Used with syslog to aggregate logs.
Even though structured logging is quite useful on individual system. However until we have logs from all the system collected and indexed together, power of structured logging is under utilized. So lets look at what are different ways we can aggregate logs from multiple systems.
How to aggregate logs?
There are multiple approaches available for log aggregation.
Log File Replication
Simplest one is, continue logging to file system on application server and set up an independent process to monitor files and send logs to central log server every ’n’ milliseconds.
Syslog
To achieve real time monitoring and alerting we can use syslog approach, directly feeding logs to a central log server. Syslog is available by default on most of the linux machines. rsyslog or syslog-ng are two popular syslog implementations.
Agents
Most of the products in this space provide their own agents, which runs on client and sends logs real-time to central log server. e.g. Splunk, LogEntries etc. There are specific tools available just for aggregation purposes like Apache Flume.

In distributed systems it is important that we have realtime log aggregation setup. And it is equally important that time on all application servers is in sync. Since a millisecond differences can have unordered logs and leads to confusion and errors while debugging and reporting.
More usages
Debugging
- With database logs find all slow running database queries
- Using Nginx access logs, find slow response pages
- Nginx access logs to generate daily reports for 404s
Reporting
- With transaction logs, turn data into knowledge. Generating reports for sales, registrations, popular products added in cart etc.
Monitoring & Alerting
- Email alert setup for jobs
- With logging of server memory, cpu, disk and network utilisation provides server monitoring.
Performance Benchmarking
- Daily report for server response time, and when 90 percentile of response time goes higher than 3 seconds send alerts.
Analytics
- Logs collected over years is the biggest data available for analytics. We could also achieve real-time analytics such as most popular products.
And these are just some examples of structured logging usage. However, once infrastructure in place, it is upto us to explore and find more opportunity to leverage it.
Last modified on 2014-09-06